Understand your analytics dashboard
Read your Revenue, orders, and channel breakdown at a glance, over 7, 30, or 90 days.
- 1
Pick a date range
Go to Analytics and choose 7d, 30d, or 90d — each figure shows a percentage change against the equivalent prior period.

- 2
Check the headline numbers
Revenue, order count, and average order value sit at the top.

- 3
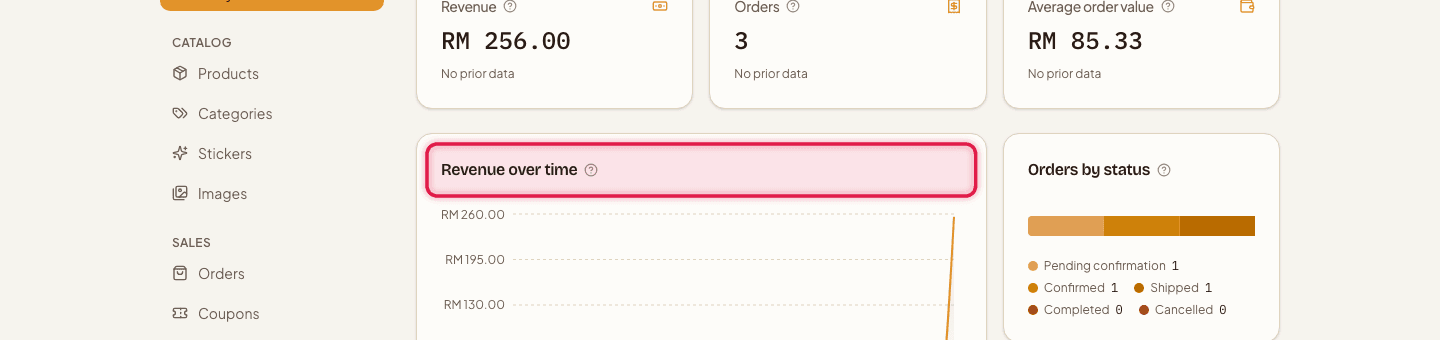
Read the trend chart
The revenue trend chart shows how sales moved over the selected period.
- 4
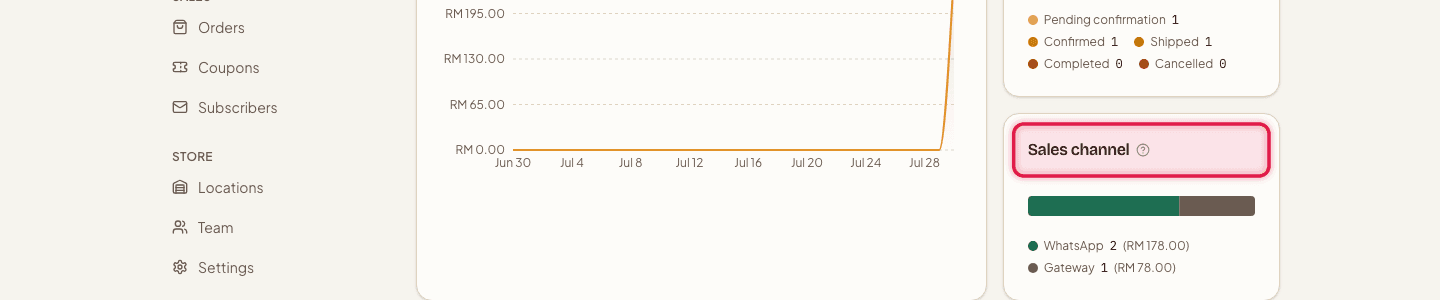
See where orders come from
The channel breakdown chart compares WhatsApp orders against online-payment orders.
- 5
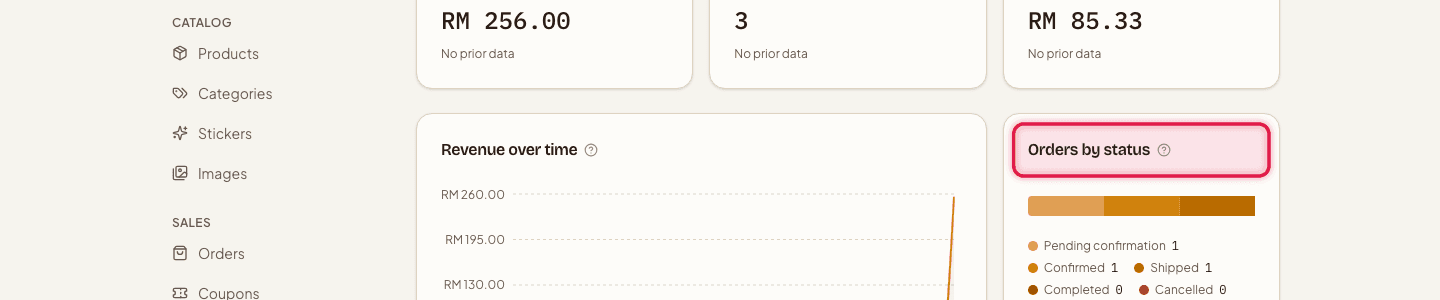
See order status mix
The order status breakdown shows how many orders sit in each of the 5 statuses.
- 6
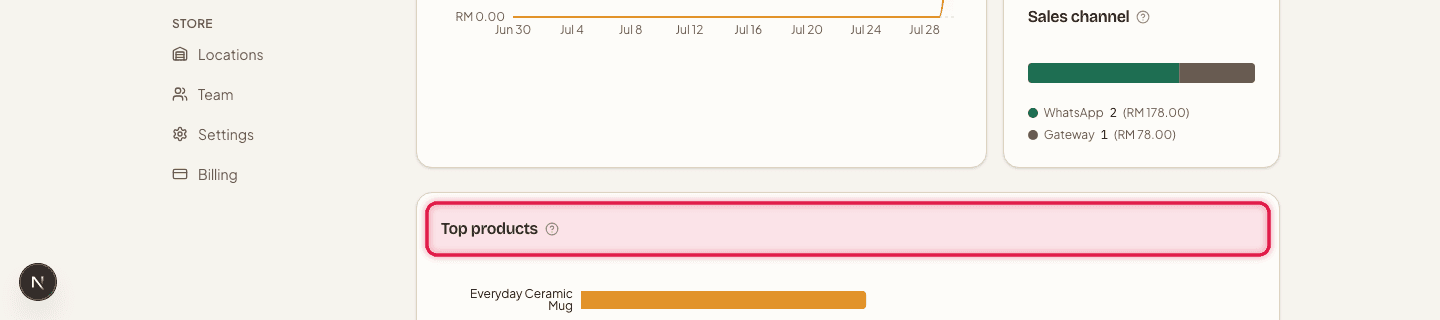
Spot your best sellers
The top products chart ranks what's actually selling.
Analytics is included on every plan, from Free up to Pro.
Still stuck?
Contact us and we'll help you sort it out.